 Ted Tschopp
The village had grown quickly. New roads stretched toward the hills. New wells had been dug. New houses stood where barley fields used to be. The elders needed to decide where to build the next bridge, where to widen the road, and where travelers might safely pass in the winter rains.
So they hired a mapmaker who came up with a beautiful map.
It was drawn on thick paper. The rivers were blue. The roads were clean. The hills were shaded with such care that everyone in the room leaned closer. At the bottom, in a strong hand, the mapmaker had written: Best Route North.
The elders were impressed.
But an old carpenter in the back asked one question.
“Who walked the road?”
The room went quiet.
The mapmaker explained that some roads had been surveyed, some had been described by merchants, some had been copied from older maps, and one bridge was drawn where the mapmaker believed a bridge was likely to be.
The carpenter nodded.
“So the map is useful,” he said. “But it is not the road.”
That is the lesson I keep returning to with AI.
A polished AI demo can feel like the answer has arrived. The interface is clean. The response is fluent. The summary sounds confident. The room gets quiet because, for a moment, it feels like the future has walked in wearing a pressed shirt.
But an AI output without provenance is not a decision system.
It is a performance.
And when the work touches infrastructure, capital planning, customer commitments, risk, compliance, operations, or public trust, that distinction matters.
AI does not remove the need for evidence.
It raises the cost of forgetting where the evidence came from.
This became clear while working through a repository focused on data center siting and large-load modeling. The starting point was reVeal, an open-source geospatial modeling package from NatLabRockies for analyzing large electric loads and their spatial deployment patterns.
The original activity involved maps, grids, public datasets, proxy inputs, and executive reporting. But the deeper lesson was about AI: what happens when a polished analytic artifact starts to feel more certain than the evidence underneath it.
The specific domain was data center siting.
The broader lesson was AI governance.
Not governance as theater.
Not governance as a committee waiting at the end of the hallway.
Governance as the quiet discipline of knowing what an artifact is allowed to mean.
Every enterprise has seen some version of this pattern. A polished map shows where the opportunities are. The colors are precise. The scores are ranked. The labels sound authoritative. The temptation is to treat the map as the answer.
But a map without provenance is not a decision system.
It is a slide.
That distinction matters, especially when the decision touches infrastructure, power demand, community impact, capital planning, and long-term operating risk.
The goal was not simply to make a better visualization.
The goal was to answer a more basic enterprise question:
What can we actually trust?
Bottom Line Up Front
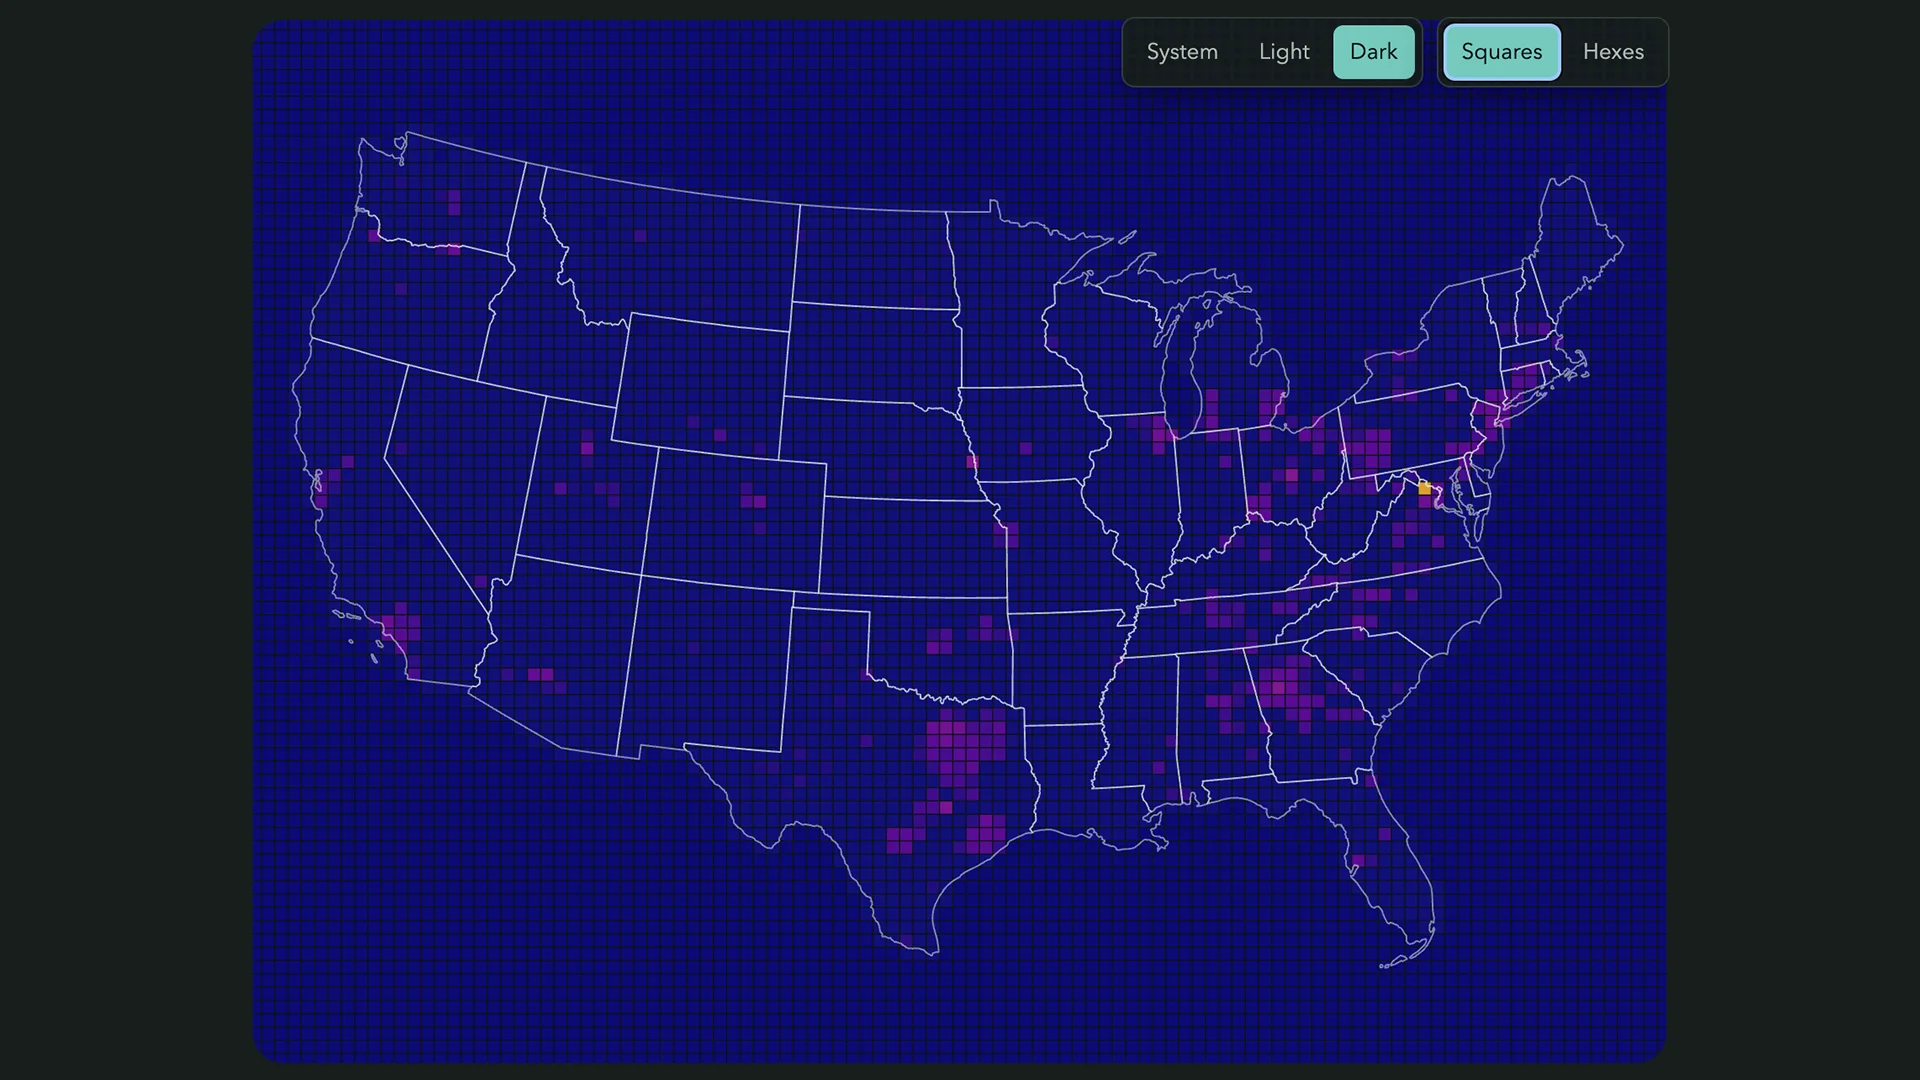
Over the weekend, I lived the story of that village. I spent the time building out a map of the most likely places where new AI inference data centers may be built in the United States over the next 30 years. This is what I learned from that experience.
But to be fair to you as the reader: I saw someone had created a map showing where data centers might be built moving forward. I tried to recreate his map. I did not recreate the original data center siting report exactly.
And that is the point.
The original report depended on several inputs and methods that were either commercial, not fully cited, not recovered, or not yet reproducible from public sources. Rather than pretend those gaps did not exist, I turned the work into a bounded public approximation.
That means:
- The workflow can be rerun.
- The outputs can be inspected.
- The assumptions are explicit.
- The missing pieces are documented.
- The executive view is useful for screening.
- The result is not presented as investment-grade site evidence.
All these caveats matter. They are not weaknesses. They are governance.
The Problem Was Not Just Technical
On the surface, determining where the next mega-project data center will be located looks like a geospatial analytics problem.
Which regions have enough energy, land, fiber, gas, water, permitting support, and social acceptance? Where might load growth concentrate over time?
Those are technical questions. They need data, models, and maps.
But in an enterprise setting, the harder question is usually different:
Can leaders tell the difference between a finding, a proxy, a heuristic, an assumption, and a gap?
That is where many analytics efforts break down. It is also where just about every AI effort I have seen breaks down as well.
The model may run. The map may render. The dashboard may look impressive. But if the organization cannot tell which parts are evidence and which parts are approximation, the tool creates false confidence.
False confidence scales badly.
What We Started With
The repository started from a copy of an open-source project that provides a framework for large-load site suitability and downscaling. In plain English, it helps model where future electricity demand might land geographically.
That is a strong technical foundation.
But the upstream project did not include a complete public reproduction of the specific data center siting report. It did not include a public substitute catalog for missing data. It did not include an executive-facing report bundle. It did not include explicit machine-readable contracts that say, “Here is what we know, here is what we approximated, and here is what is still blocked.”
Those are the pieces this work added.
Not to make the analysis look more complete than it is.
To make it harder to misuse.
The important question is this: do your teams go through this effort to make the work more trustworthy, or do they just make it look more professional?
What Was Added
The repository now has a report-facing public-data workflow layered on top of the original modeling package.
At a high level, the additions fall into six categories.
1. A Dataset Inventory And Gap Register
The repo now tracks what data is expected, what has been found, what is public, what is commercial, and what remains unresolved.
That sounds mundane.
It is not.
In enterprise analytics, the dataset inventory is often treated as administrative overhead. In reality, it is the control surface for trust. If nobody can tell where the inputs came from, nobody should treat the outputs as decision-grade.
The repository now distinguishes:
- Public sources that can be staged and transformed.
- Commercial or unrecovered sources that block exact reproduction.
- Public substitutes that can support a bounded approximation.
- Generated artifacts that should not be committed as source data.
That gives reviewers a clear operating model instead of a folder full of mystery files.
2. Public Proxy Workflows
Several report inputs could not be reproduced exactly from the available evidence. So the repo now implements public proxy workflows for areas such as:
- Data center inventory.
- Power infrastructure.
- Fiber availability and route-like indicators.
- Gas service territories.
- Land value.
- Construction cost.
- Water availability.
- Reserve-margin context.
Each proxy is documented as a proxy.
This matters. A proxy can be useful. It can guide investigation. It can help rank uncertainty. It can support a first-pass screen.
But a proxy is not the same thing as the missing source. Treating it as equivalent would be a category error.
3. A Bounded Public Report Bundle
The repo now includes a command that materializes a local report bundle. That bundle produces an executive-facing HTML view plus supporting data files, manifests, assumptions, limitations, and deviation notes.
It is designed for review, not just exploration. It includes:
- Suitability screening.
- Priority candidate cells.
- Light and dark mode.
- Square and hex display modes.
- State boundary context.
- Risk overlays.
- Census-backed cell labels where available.
- Buildout timeline controls.
- Summary framing for executive discussion.
The internal grid remains the model. The hexagons are display geometry for faster visual scanning. That is another small but important distinction: change the presentation layer without pretending the model changed underneath.
4. Explicit Assumption Contracts
This is one of the most important parts of the work.
The report bundle does not just emit a map. It emits contracts.
Those contracts document assumptions and blockers around:
- Baseline year.
- Buildout horizon.
- Capacity constraints.
- Grid resolution.
- Allocation method.
- Baxtel schema readiness.
- ReEDS handoff expectations.
Think of these as structured truth labels for the analysis.
They make the boundary visible. They also make future improvement easier because the next person can see exactly what must change before the work can move from bounded approximation toward stronger parity.
This is how governance becomes practical. Again, governance is not a slogan. It is not a committee. It is a contract the workflow writes every time it runs.
5. A Clear Generated-Versus-Tracked Policy
The repo now separates source-of-truth files from generated local deliverables.
Tracked files include source code, tests, manifests, provenance notes, small configuration artifacts, and documentation.
Files not stored long term include downloaded raw data, unpacked working files, runnable example bundles, generated report-bundle payloads such as HTML, GeoPackages, JSON, CSV, Markdown outputs, and local API caches.
This is important because enterprise repositories get messy quickly.
If generated outputs are committed casually, the repo becomes a junk drawer. Nobody knows what is source, what is build artifact, what is stale, and what is authoritative.
That does not scale past a single person who worked on the repository from the beginning. It is not an enterprise operating model.
6. A Coworker Handoff Model
The repo now includes documentation intended for people who did not build the system.
That includes:
- A coworker-facing report-bundle guide.
- A deviation summary.
- A publishing checklist.
- A usage guide with regeneration commands.
- A clearer external-data policy.
- Example workflow documentation.
This is not just polish. If a solution only works when the original builder is in the room, it is not ready for enterprise use. It is a personal tool with a nice interface.
The handoff materials force the work to answer basic questions:
- What is in this?
- What is missing?
- Where did it come from?
- What changed from the starting point?
- What can be regenerated?
- What should not be committed?
- What should executives not infer from the map?
Those questions are not optional. They are the work.
What Is Still Missing
The current bundle is intentionally honest about what it does not have.
The major blockers are still significant:
- The exact source report inputs are not fully recovered.
- The report-reference 5.76 km national grid is not reconstructed.
- The report’s 2025 operating data center baseline is not available.
- Licensed Baxtel data, exact schema, and trained suitability workflow are not recovered.
- The exact report allocation algorithm is not recovered.
- Several risk layers remain bounded proxies rather than report-grade evidence.
That means the current system can support executive screening and structured discussion.
It should not be used to claim exact report reproduction.
It should not rank individual parcels for investment.
It should not treat zoning, permitting, social acceptance, or hosting capacity proxies as proof.
This is where executive discipline matters.
The tool can show where to investigate next.
It cannot, by itself, say where to build.
The Real Lesson For Enterprise Leaders
This work is about data center siting, but the lesson is broader.
Most organizations are under pressure to move faster with data, automation, analytics, and AI. That pressure is real. The opportunity is real.
But speed without traceability creates a different kind of risk.
The problem is not that models are imperfect. All models are imperfect.
The problem is when the organization forgets where the imperfections are.
In regulated or infrastructure-heavy environments, that matters. Decisions have long tails. A model can influence capital planning, operational posture, public commitments, customer expectations, and regulatory conversations.
Once an analytic artifact enters the executive conversation, it becomes part of the operating system of the organization.
That means it needs controls.
Not controls that slow everything down for no reason.
Controls that preserve meaning.
What Good Looks Like
A mature enterprise analytics workflow should be able to answer five questions without drama.
What problem are we solving?
In this case: identifying where future data center load might plausibly concentrate and where further investigation is warranted.
Not selecting parcels.
Not approving investments.
Not claiming exact reproduction of a prior report.
What evidence do we have?
The repo now tracks public inputs, public substitutes, staged examples, generated outputs, and supporting provenance.
That makes the evidence inspectable.
What did we assume?
The bundle writes assumption contracts for baseline year, capacity, grid resolution, allocation, vendor schema readiness, and downstream handoff.
That makes assumptions part of the product, not buried in a conversation.
What is missing?
The repo explicitly names the missing commercial inputs, unrecovered methodology, grid parity, baseline mismatch, and proxy limitations.
That prevents quiet drift from “useful approximation” to “authoritative answer.”
What decision can this support?
The current answer is clear: investigation prioritization.
That is valuable.
But it is not the same as investment approval.
Why This Matters In The AI Era
AI will make it easier to generate analysis, maps, summaries, and recommendations.
That is useful.
It also increases the cost of pretending we have governance when we do not.
If teams can create decision artifacts faster than the organization can validate them, the bottleneck moves. The constraint is no longer just technical delivery.
The constraint becomes the operating model:
- Can we trace the inputs?
- Can we inspect the assumptions?
- Can we separate evidence from proxy?
- Can we reproduce the output?
- Can we explain what decision the artifact is allowed to support?
- Can we stop a polished visualization from becoming false certainty?
Those are management questions as much as technical ones.
Executives do not need every implementation detail. But they do need to know whether the artifact in front of them is a screen, a forecast, a recommendation, or a decision record.
Those are different things.
Treating them as the same thing is how organizations get into trouble.
The Shift I Want More Teams To Make
Too many enterprise analytics and AI projects optimize for the final picture.
The better pattern is to optimize for the decision boundary.
The map matters. The model matters. The data matters.
But the most important question is this:
What is this artifact allowed to mean?
For this repository, the answer is explicit.
It is a bounded public approximation of a data center siting workflow. It can help leaders see candidate geography, understand modeled buildout pressure, review proxy risk context, and identify what evidence is still needed.
It is not a final siting answer.
That clarity makes the work more useful, not less.
Because now people can use it without pretending.
Closing Thought
Back in the village, the elders did not throw away the map.
That would have been foolish.
The map was beautiful. It gathered knowledge. It showed patterns no one person could easily hold in mind. It gave the village a way to talk about roads, rivers, bridges, and risk.
But after the carpenter spoke, they changed how they used it.
They wrote in the margins.
Surveyed. Reported. Copied from last year’s map. Bridge not yet verified. Road washed out in winter. Ask the shepherds before sending wagons.
The map became more marked up.
Less pristine.
More useful.
And when the elders finally chose where to build, they did not say, “The map told us.”
They said, “The map helped us ask better questions.”
That is what I want from enterprise AI.
Not magic.
Not theater.
Not a voice so fluent that we forget to be wise.
I want AI that helps us see. AI that carries its caveats. AI that remembers where its evidence came from. AI that serves the decision without pretending to be the decision.
In enterprise AI, trust is not created by a confident answer.
Trust is created by knowing what the answer can and cannot support.
The hard part is not generating the output.
The hard part is keeping the output honest after it enters the room.
That is the work.