 Ted Tschopp
Open the tool
The Color Chart tool lives here:
Think of it like a map: the screen is your viewport, and the chart is a larger world behind it.
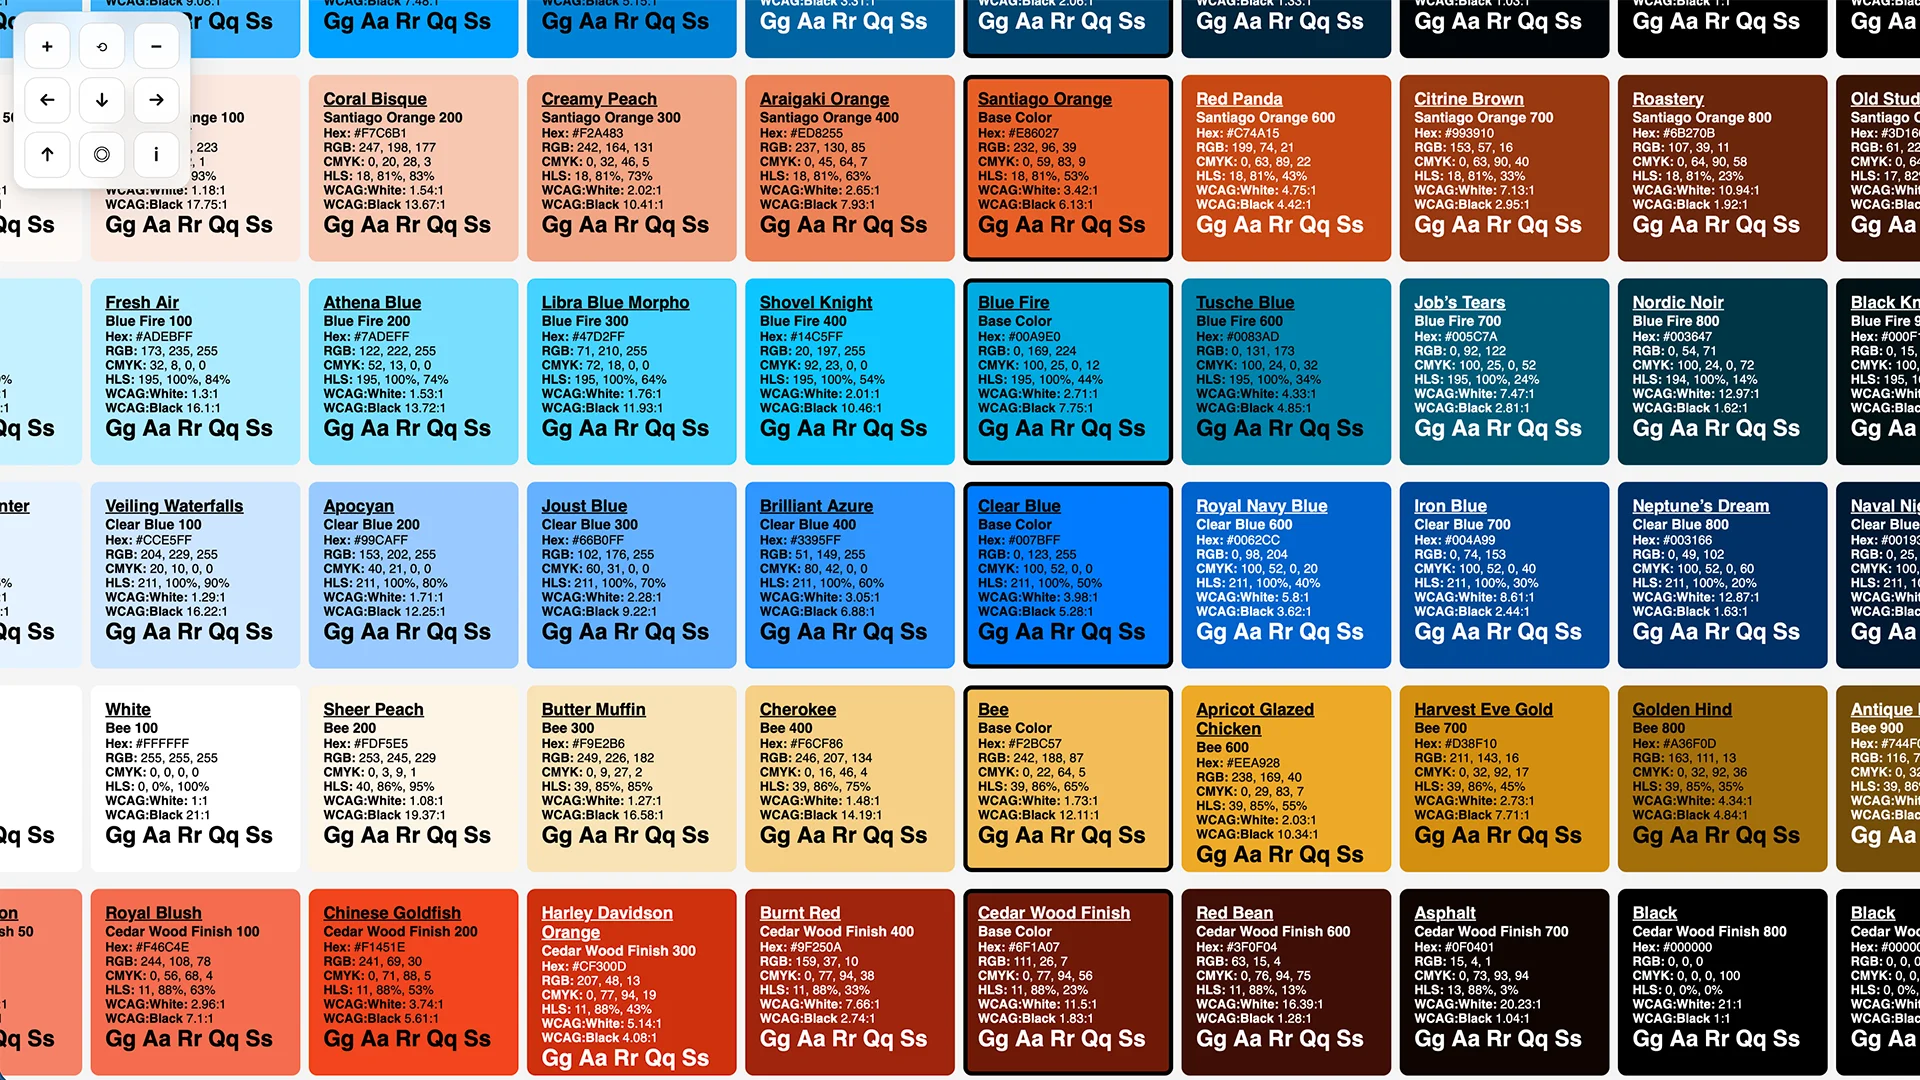
What the tool does
Given one or more base colors, the tool generates a grid of shades and supporting metadata (RGB/HSL/CMYK and contrast information) so you can evaluate a palette as a system, not as a collection of isolated swatches.
Pan and zoom (three ways)
1) On-screen controls
The tool overlays a small control pad in the upper-left:
+zoom in−zoom out⟲reset view← ↑ → ↓pan◎center the chart in the viewportitoggle the status readout (zoom % and x/y offset)
2) Mouse / trackpad
- Drag anywhere on the chart background to pan.
- Use the mouse wheel / trackpad scroll to zoom toward the pointer location.
3) Keyboard shortcuts
- Arrow keys: pan
- Shift + arrow keys: pan faster
+/=: zoom in-/_: zoom out0: reset
Feeding the tool your own palette (URL parameter)
The tool accepts a c query parameter so you can generate a chart from a specific palette without editing the file.
Examples
Use the built-in “teds” palette:
https://tedt.org/tools/color-chart.html?c=teds
Provide a comma-separated list of hex colors:
https://tedt.org/tools/color-chart.html?c=%2300a9e0,%23101820,%23fed141
Notes:
- You can include
#or omit it (the tool will add it when it’s clearly a hex value). - 3-digit hex values (like
#0af) are expanded to 6-digit (#00aaff). - 8-digit hex values (
#RRGGBBAA) are accepted; how the alpha channel affects the rendered swatch depends on browser + color parsing.
A small (honest) note about network calls
Some metadata (like human-friendly color names) may rely on an external lookup. If you’re offline, or if a third-party service is slow, the chart still renders — but names may be missing or delayed.
Why this matters (and why it’s worth documenting)
When a chart can’t move, you end up moving around it.
When a chart can move, you stop fighting the tool.
And once you stop fighting the tool, you can do the real work: noticing what the palette is actually saying.
If you want, I can also add a tiny “Help” overlay directly inside the tool (a quick legend for controls and the ?c= parameter), so you don’t have to remember any of this next time.