 Ted Tschopp
Color Chart
Fullscreen palette workbench with pan/zoom, contrast matrix, token export, WebMCP tools, semantic roles, audits, previews, and source image extraction.

What it does
Color Chart is a fullscreen palette workbench: it turns one or more base colors
into a grid of related shades, then lets you move around the chart (pan and
zoom) to evaluate the palette as a system. It can also extract a starting
palette from browser-readable URLs, uploaded images, or pasted screenshots, then
audit, compare, export, and preview the palette in common UI contexts.
When a browser or browser agent exposes the draft WebMCP document.modelContext
API, the page also registers read-only and state-changing palette tools for
agent workflows.
How to use it
- Open the tool: /tools/color-chart.html
- Pan: drag the background (or use arrow keys / on-screen arrows)
- Zoom: mouse wheel / trackpad scroll, or
+/-(or the on-screen+/−buttons) - Reset:
0(or the reset button) - Extract from source: enter a readable URL, upload an image, or paste a screenshot into the tool.
- Use the workbench: check shade-pair contrast, export tokens, map semantic roles, audit the palette, build themes, compare palettes, preview color-vision simulations, test light/dark UI components, or sample image regions.
- Use WebMCP: in supporting browser agents, call registered Color Chart tools for palette metadata, contrast, shade generation, token export, comparison, auditing, share URL creation, palette updates, and role assignment.
URL palettes (?c=)
You can generate a chart from a specific palette without editing the tool:
- Built-in palette:
https://tedt.org/tools/color-chart.html?c=teds - Comma-separated hex:
https://tedt.org/tools/color-chart.html?c=%2300a9e0,%23101820,%23fed141
Notes
- Full usage docs live here: A Color Chart You Can Move Around
- Arbitrary websites may block direct browser analysis. In that case, paste or upload a screenshot; no backend proxy is used.
- The tool is intentionally self-contained (single HTML file) so it can be copied/modified easily.
Details
- JavaScript
- HTML
- CSS
Features
- Pan/zoom navigation (mouse/trackpad/keyboard + on-screen controls)
- URL-driven palettes via ?c=
- Palette extraction from readable URLs, uploaded images, and pasted screenshots
- Swatch metadata (RGB/HSL/CMYK) + contrast cues
- Workbench contrast matrix for shade pair accessibility checks
- Design token exports for CSS, JSON, SCSS, Tailwind, and Bootstrap
- Semantic role mapping with color-rich role dropdowns, role token export, shared brand/status roles, and separate light/dark surface roles
- Palette audit, theme suggestions, comparison, color-vision simulation, dual-mode UI preview, and manual image sampling
- WebMCP tool registration for browser agents that expose document.modelContext
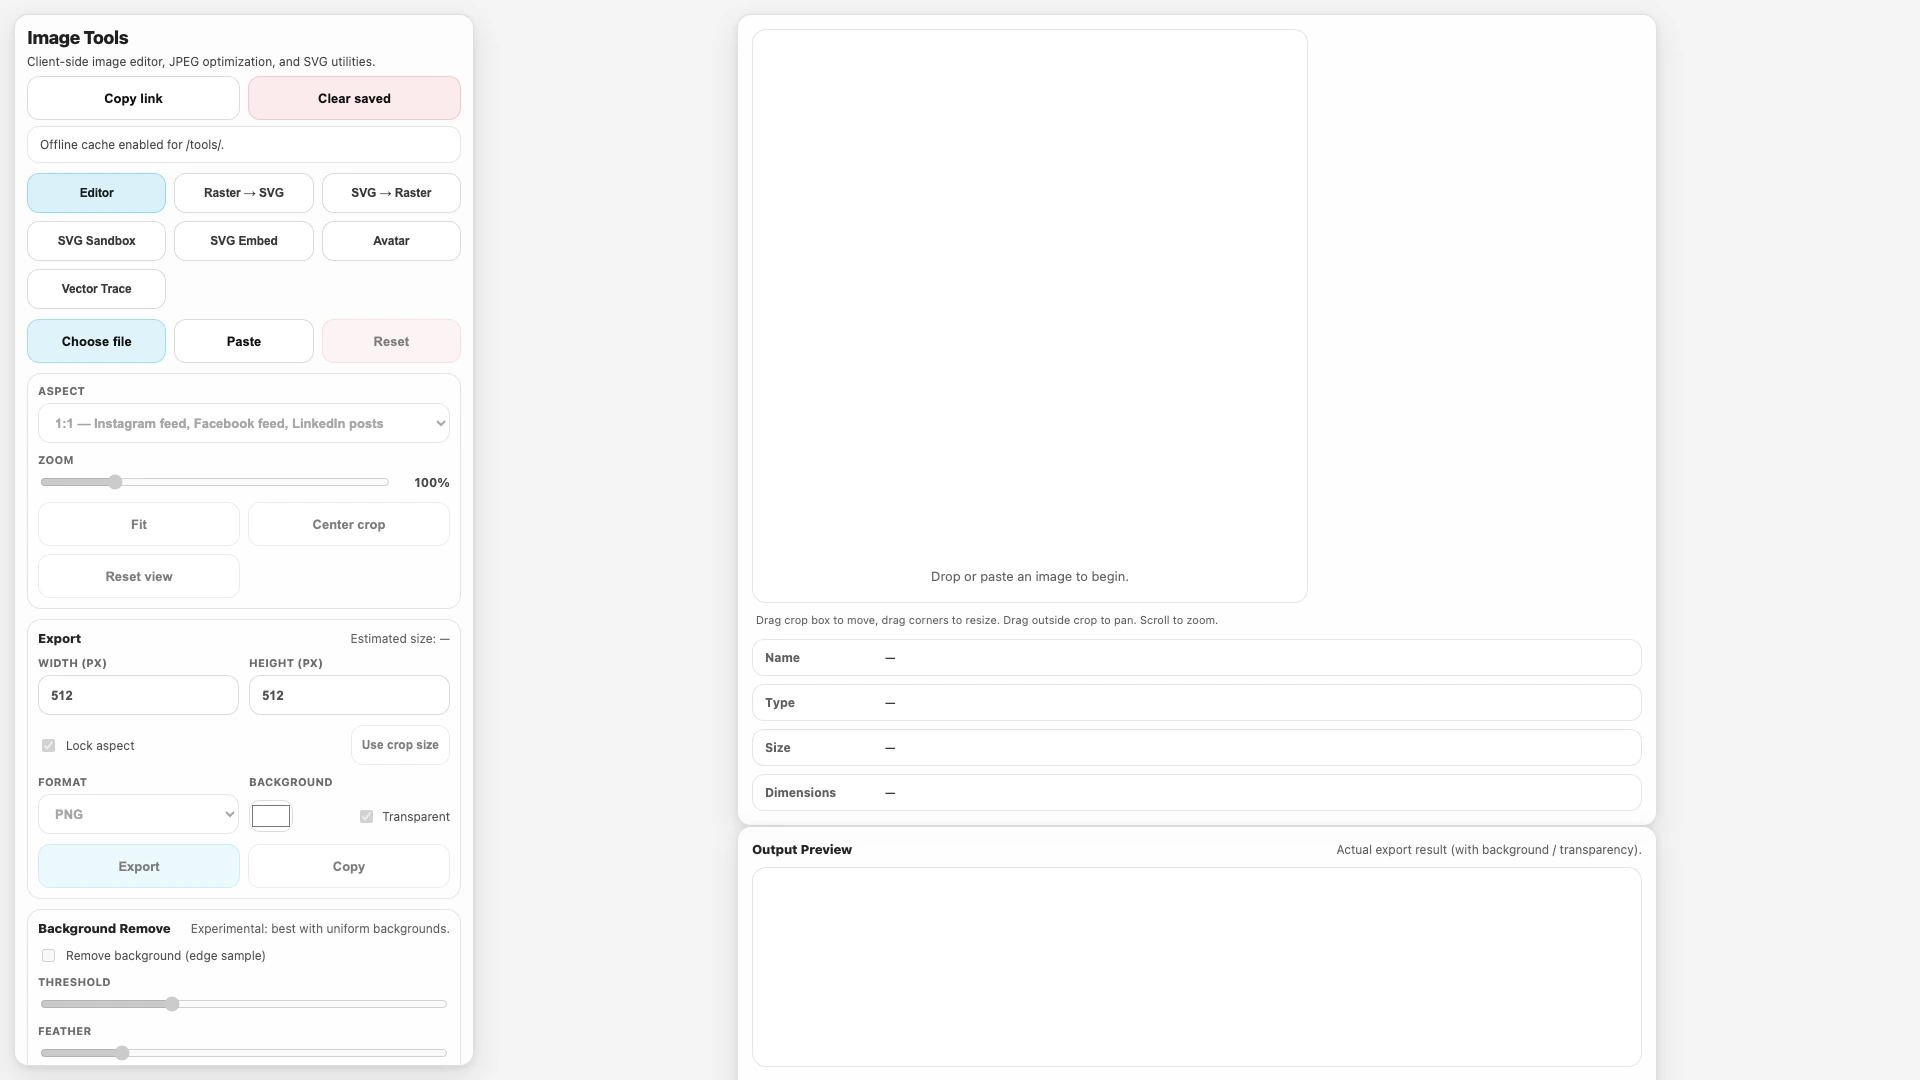
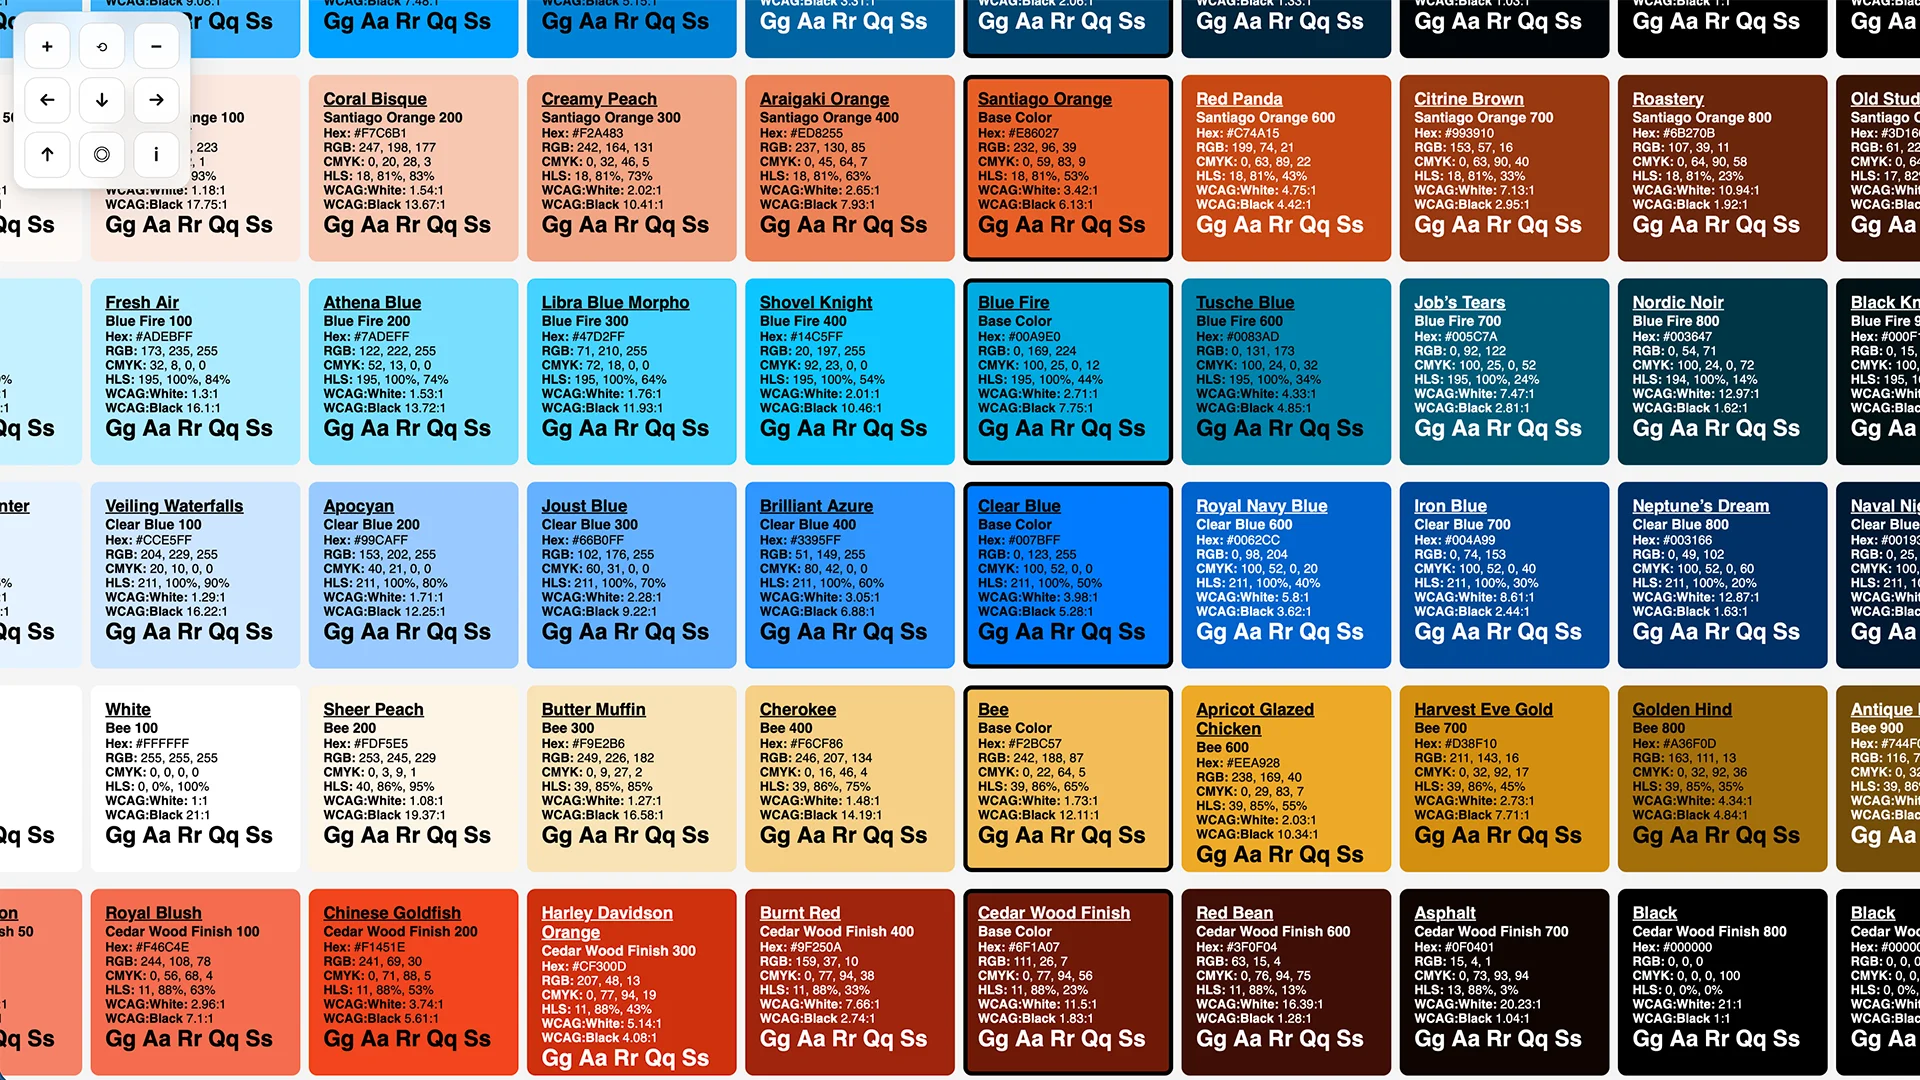
Screenshots